Examples
Let us consider several sources and their corresponding interferograms [2,4] :
Case of monochromatic radiation
In the case where the spectrum is only composed of a monochromatic wave with a wavelength
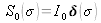
 , we can model the spectrum as:
Therefore, the spectral envelope is reduced to a Dirac distribution
 . The Fourier transform
 is
is
 . The degree of coherence is then:
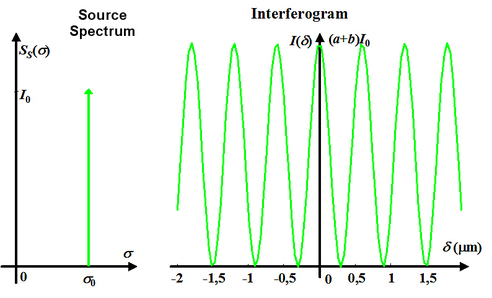
The coherence length is thus infinite, since the degree of coherence cannot be integrated. The interference signal is then:
The spectrum and its interferogram are represented in figure 9 for a monochromatic source with a wavelength of
 .
.
![[zoom...]](javascript:window.open(%22../res/fig_09_C_1.jpg%22,%22_blank%22,%22width=%22+Math.min(800,screen.availWidth)+%22,height=%22+Math.min(600,screen.availWidth)+%22,left=%22+(screen.availWidth-800)/2+%22,top=%22+(screen.availHeight-600)/2+%22,scrollbars=yes,resizable=yes%22)?void(0):void(0))
Case of two wavelengths
If the source includes two monochromatic waves with wave numbers
 with
with
 and equal amplitude
 , its spectrum can be modeled as:
In this case, the average wave number of the spectrum is
 and the spectral interval is
 . We then have:
and since
 is the spectral envelope (see figure 8), we have:
for which the Fourier transform is:
The degree of temporal coherence is thus:
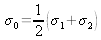
The interference signal is written as:
The interferogram shows beats. They are represented in figure 10 in the case that
 and
and
 .
.
![[zoom...]](javascript:window.open(%22../res/fig_10_C_1.jpg%22,%22_blank%22,%22width=%22+Math.min(800,screen.availWidth)+%22,height=%22+Math.min(600,screen.availWidth)+%22,left=%22+(screen.availWidth-800)/2+%22,top=%22+(screen.availHeight-600)/2+%22,scrollbars=yes,resizable=yes%22)?void(0):void(0))
In this ideal case where the line width is considered as infinitely narrow, the coherence length is also infinite because the degree cannot be calculated. However, in reality, it is necessary to consider the width of each line as well as a model for the lineshape. We would then see that the degree of coherence can be calculated, and that the coherence length is not infinite but depends significantly on the line width.
Case of a rectangular spectrum distribution
If we consider a uniform spectrum distribution on the interval
 centered on
 and with amplitude
 , the spectrum is described by the rectangular function:
and:
for which the Fourier transform is:
for the following equations, the sinc function is defined by
The intensity distribution is written as:
The degree of coherence of a given source is thus:
The spectrum and the interferogram are represented in figure 11, in the case where
 and
and
 (simplified model of white light).

![[zoom...]](javascript:window.open(%22../res/fig_11_C_1.jpg%22,%22_blank%22,%22width=%22+Math.min(800,screen.availWidth)+%22,height=%22+Math.min(600,screen.availWidth)+%22,left=%22+(screen.availWidth-800)/2+%22,top=%22+(screen.availHeight-600)/2+%22,scrollbars=yes,resizable=yes%22)?void(0):void(0))
The coherence length is obtained by calculating:
which gives:
With the numerical values, we find that
 and
and
 .
.
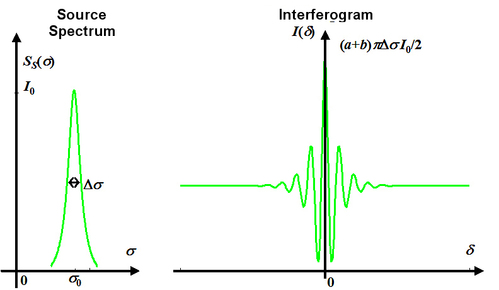
Case of a monochromatic wave with a lorentzian spectral distribution
This situation corresponds to the broadening of spectral lines by the Doppler effect, which is caused by thermal agitation in the emitting medium. The spectral intensity can be modeled by:
where
 represents the length of the line at mid-height.
The envelope of the spectrum allocation is described by:
for which the Fourier transform is:
The degree of temporal coherence is:
The intensity is expressed as:
The wider the line is and the faster the interferogram decreases, then the ability to observe the signal modulation also decreases. The spectrum and the interferogram are represented schematically in figure 12.
![[zoom...]](javascript:window.open(%22../res/fig_12_C_1.jpg%22,%22_blank%22,%22width=%22+Math.min(800,screen.availWidth)+%22,height=%22+Math.min(600,screen.availWidth)+%22,left=%22+(screen.availWidth-800)/2+%22,top=%22+(screen.availHeight-600)/2+%22,scrollbars=yes,resizable=yes%22)?void(0):void(0))
The coherence length is:
which gives:
For example, in the case of a diode laser for which
 and
and
 we have
 . We can calculate that
 and
and
 . With the parameters, the graphic representation of the interferogram of an optical path difference equal to the coherence length is not possible to the large number of oscillations of
 under the modulation curve.