Statistics of the electrical output signal
The output signal from an electro-optical sensor is supposed to be different when the pertinent signal is present and when there is only noise : one of the most usual procedures for discriminating signal from noise (or bit 1 from bit 0 in digital telecommunications) is « threshold logic » in which, by comparison of the output voltage with some preset threshold value Vth , a binary decision is made by the sensor about the input signal : presence or absence of target, bit 1 or bit , in the following manner :
-
if v > Vth ===> presence of target (or presence of bit 1)
-
if v < Vth ===> absence of target (or presence of bit 0)
We have seen above that the voltage across the detector load resistor is noisy. Without getting into the details of each case, one must recall that noise levels depend upon such parameters as : mode of detection, spectral domain, scene lighting, type of source, detector,... One must also remember that noise and signal have to be defined, evaluted or measured at the same point (usually at the outset of the detector, and inside the same electrical bandpass, i.e. the electronic bandpass of the sensor.
Among other problems, the designer of an electro-optical sensor is facing the following ones : which values must be assigned to the threshold and to the SNR in order for the sensor to satisfy its specifications, generally expressed as probability of detection ( this probability of detecting the target when present must be maximized) and false alarm rate (the number of false detections per unit time or per usage duration must be minimized). In order to answer those two questions, one characterizes the statistical properties of the output signal by means of its probability density. If the output is the instantaneous voltage across the load resistor, the probability density p(v), then represents the voltage distribution function resulting from a large number of samples (either from modelling or from measurements). The probability Pr for an instantaneous voltage sample to be comprised between two values, v and v +dv, is given by the following relationship :
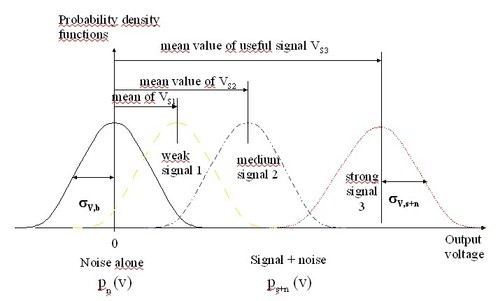
Let us consider that, in the absence of the target or of the expected signal, the output voltage is characterized by the « noise alone probability density function » pn(v), and let us suppose, for mathematical convenience, that its average value is equal to zero, for example by means of some decoupling capacitance. Now, let us suppose that, in the presence of the target, the output voltage probability density is modified (if not, one can easily understand that there is no use going any further in the design of the sensor) : it becomes the « signal + noise probability density function », ps+n (v), Its average value, corresponds to that of the signal flux that is incident upon the detector, vs , (vs is the value that is computed by the procedure described in part D.1. of the course). Let σv,n and σv,s+n be the rms values of these voltage probability density functions, respectively obtained in the absence and in the presence of the target.
In order to illustrate these parameters, figure 1 (CS) below compares three distinct configurations, where one can observe a typical noise voltage probability density function and probability density functions corresponding to signals at three different levels : weak, medium, and strong. A rapid analysis of this figure shows that, as the separation between the average values the curves (« noise alone » and « signal + noise ») gets larger, decision making by the sensor (presence or absence of target) gets easier. That means that the larger the ratios vs/σv,n and vs /σv,s+n the better the performance of the sensor.
![[zoom...]](javascript:window.open(%22../res/Fig_16_2.jpg%22,%22_blank%22,%22width=%22+Math.min(800,screen.availWidth)+%22,height=%22+Math.min(600,screen.availWidth)+%22,left=%22+(screen.availWidth-800)/2+%22,top=%22+(screen.availHeight-600)/2+%22,scrollbars=yes,resizable=yes%22)?void(0):void(0))
These two ratios are respectively the « signal to noise ratio with respect to internal noise of the sensor » (i.e. noise level in the absence of target) and the signal to « noise ratio due to the signal ». Their influence upon the performance of an electro-optical detection sensor is fundamental.