Probability of detection and minimal value of SNR
From the point of view of the user, an EO detection sensor is characterized by its false alarm rate and by its probability of detection. We have seen that the first criterion, FAR, is the one that defines the threshold value to be imposed upon the output. In what follows, it is shown how the designer must take into account the second one, i.e. the probability of detection, in order to evaluate the minimum value of the signal to noise ratio.
By setting :
then :
f and g are said to be reciprocal functions from each other, and there comes :
and hence :
On the other hand, if the gaussian hypothesis is being representative of the « signal + noise » probability density function, the probability of detection is equal to :
and hence :
For a further simplification, we will consider here the case where the incoming signal is not fluctuating from sample to sample (signal is then said to be « certain »or « stationary »), and weak enough so that its presence or absence does not modify the noise level significantly. This approach can be justified in a vast majority of thermal infrared systems, for which the permanent background flux is much larger than the flux variation brought by the presence of the target to be detected. Consequently, the average output voltage is almost not modified by the presence of the target. If the noise is essentially due to the background radiation (in which case the sensor is said to be « BLIP », Background Limited Infrared Photodetector), the noise level is about the same in the absence or in the presence of the signal, which allows to write :
and
One concludes then that the minimum signal to noise ratio necessary for the sensor to satisfy the probability of detection and probability of false alarm (after conversion from the false alarm rate as explained above) :
The table below makes the correpondence between reciprocal functions y and g(y) for several values of y, in case of gaussian noise :
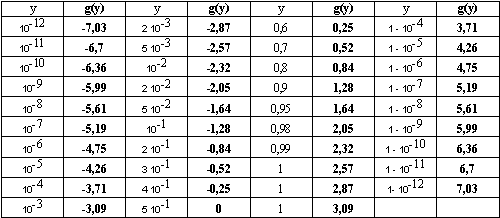
![[zoom...]](javascript:window.open(%22../res/Tableau03_1.png%22,%22_blank%22,%22width=%22+Math.min(800,screen.availWidth)+%22,height=%22+Math.min(600,screen.availWidth)+%22,left=%22+(screen.availWidth-800)/2+%22,top=%22+(screen.availHeight-600)/2+%22,scrollbars=yes,resizable=yes%22)?void(0):void(0))
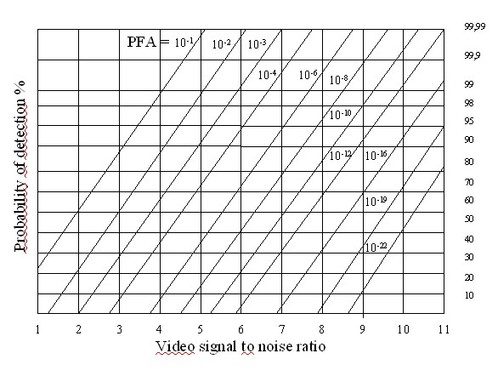
The abacus that follows (Figure 17) may then be used in order to evaluate the minimum value of signal to noise ratio that is necessary to obtain the couple of specifications requested for Pd and PFA. This abacus is meant to be used only for the detection of stationary signals embedded in noise (the signal must not fluctuate from sample to sample), so that the « noise alone » and « signal + noise » probability density functions have the same rms value.
![[zoom...]](javascript:window.open(%22../res/Fig_17_2.jpg%22,%22_blank%22,%22width=%22+Math.min(800,screen.availWidth)+%22,height=%22+Math.min(600,screen.availWidth)+%22,left=%22+(screen.availWidth-800)/2+%22,top=%22+(screen.availHeight-600)/2+%22,scrollbars=yes,resizable=yes%22)?void(0):void(0))
For example, if the required probability of detection Pd is 90%, and if the probability of false alarm PFA is 10-10, then the minimum value of the video SNR is 8.
This abacus may also be read the other way around, if simulation of the sensor shows that the expected value for its signal to noise ratio is at best SNRmax. In these conditions, the optimal performances of the sensor are all aligned along the vertical line of abscissa SNRmax. For example, let us suppose that the maximum value that is predicted by the sensor model for the signal to noise ratio is SNRmax = 6. Then, by consulting the vertical line drawn from that limiting value, one may predict that performances of the sensor will be limited to a set of (Pd, PFA) values such as : Pd =70% et PFA=10-7, Pd =85% et PFA=10-6, Pd=93% et PFA =10-5, Pd = 98% et PFA=10-4, ...
This performance analysis has been limited to the detection of stationary signals or targets as a first approach to the more general problem of electro-optical detection. In actual systems, the incoming signal to be detected is much more fluctuating than the internal noise of the sensor : this is the case, for example, of laser sensors in the presence of speckle. Among the main consequences of signal non stationarity on the design and on the performances of such systems, as compared to the stationary case, one may say the following : for the same average value in SNR, the probability of detection is increased for low SNRs, (because the probability of high signal returns is more favorable than with stationary targets), but unfortunately, at more comfortable SNR values, the probability of detection becomes lower than with stationary signals.
Hence, in order to obtain a decent probability of detection (typically larger than 80%) in presence of a wildly fluctuating signal (detection of laser pulses in the presence of speckle, for example), the designer will be forced to increase by a non negligible factor (which may be of the order of 10) the minimum SNR value by comparison with what would be necessary to detect a stationary signal in the same conditions : that means that, for obtaining comparable performances from two laser sensors, the laser power that is necessary to detect fluctuating returns may have to be ten times larger than the one that would be necessary in case of stationary returns. Signal fluctuations are very costly in terms of sensor performance.