Fiber holograms restituted by fractional FTs
Our aim is to indicate that fractional Fourier transforms allow us to restitute hologram images when the best fractional index is chosen. Once again we apply the same argument on the term noted
 and calculate its fractional Fourier transformation:
If equation (3.17) is written as the sum of fractional Fourier transforms, we obtain:
The calculation of
 and
and
 gives the following results:
and:
where:
Intensities
 and
and
 are therefore written:
and:
These expressions carry out the Radon projection of
 and
and
 following an axis
 having an angle
 with the
 axis.
axis.
Rewriting
 ) as a function of two FRFT of order
 helps its interpretation. In fact, if:
Equation (3.21) shows that
 tends to
 and therefore
 becomes a standard Fourier transform.
If we leave out the constant
 is nothing but the object function
 .
.
It is worth noting that relation (3.24) represents a digital re-focalization on the fiber image considering relation (2.29).
Actually, it corresponds to the cancellation of the phase term owing to the propagation on a distance
 . Thus, the envelope is extracted, but this envelope is used to carry out standard FTs.
The phase term cancelled by an optimal order fractional FT corresponds to an optimal rotation in the Wigner representation where one of the two branches becomes parallel to the spatial frequency axis
 . This relation is well-known to turn a frequency drift into a Dirac pulse.
Simulations
In practice, the intensity level of a diffraction figure background does not have any interest. From a physical viewpoint, it corresponds to a unitary reference wave. The constant term of
 will be therefore removed to obtain a mean close to zero.
 indicates the corrected function.
 is its representation in the fractional domain
 . For example, we will use again the curve in figure 9, obtained for
 ,
,
 and
and
 (wavelength). Its Wigner distribution function is represented in figure 11. Let us apply fractional Fourier transform on
 .
.
We obtain
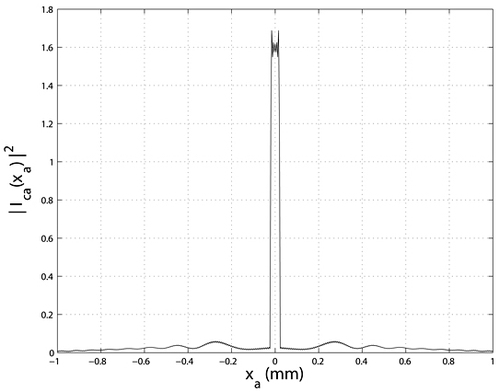
 for which figure 12 illustrates the fiber restitution.

* Figure 12:
 restitution by FRFT for the optimal fractional index 0.5.
This curve is very close to the rectangle function.
The oscillations are linked to the crossed terms of relation (3.13) and the projection of term
 on the
 axis in Wigner space.
The Wigner distribution of this transform (figure 13) highlights a
 rotation of
 . This rotation is the best one found thanks to relation (3.24). With this operation, we made the distribution linked to
 parallel to the spatial frequency axis. By calculating the square of its module, energy density is optimized by projection. If we had carried out an opposite order
 , we would have made the Wigner distribution linked to
 parallel to the spatial frequency axis as indicated in figure 13. In this case, we would have focused on real images.